microtica agents
New The shared investigation case board

Find the root cause of
cloud incidents in minutes.

Ask one question. Microtica Agents reads AWS, Kubernetes, logs, deploys, and config, then returns the root cause, evidence, and a fix you approve.
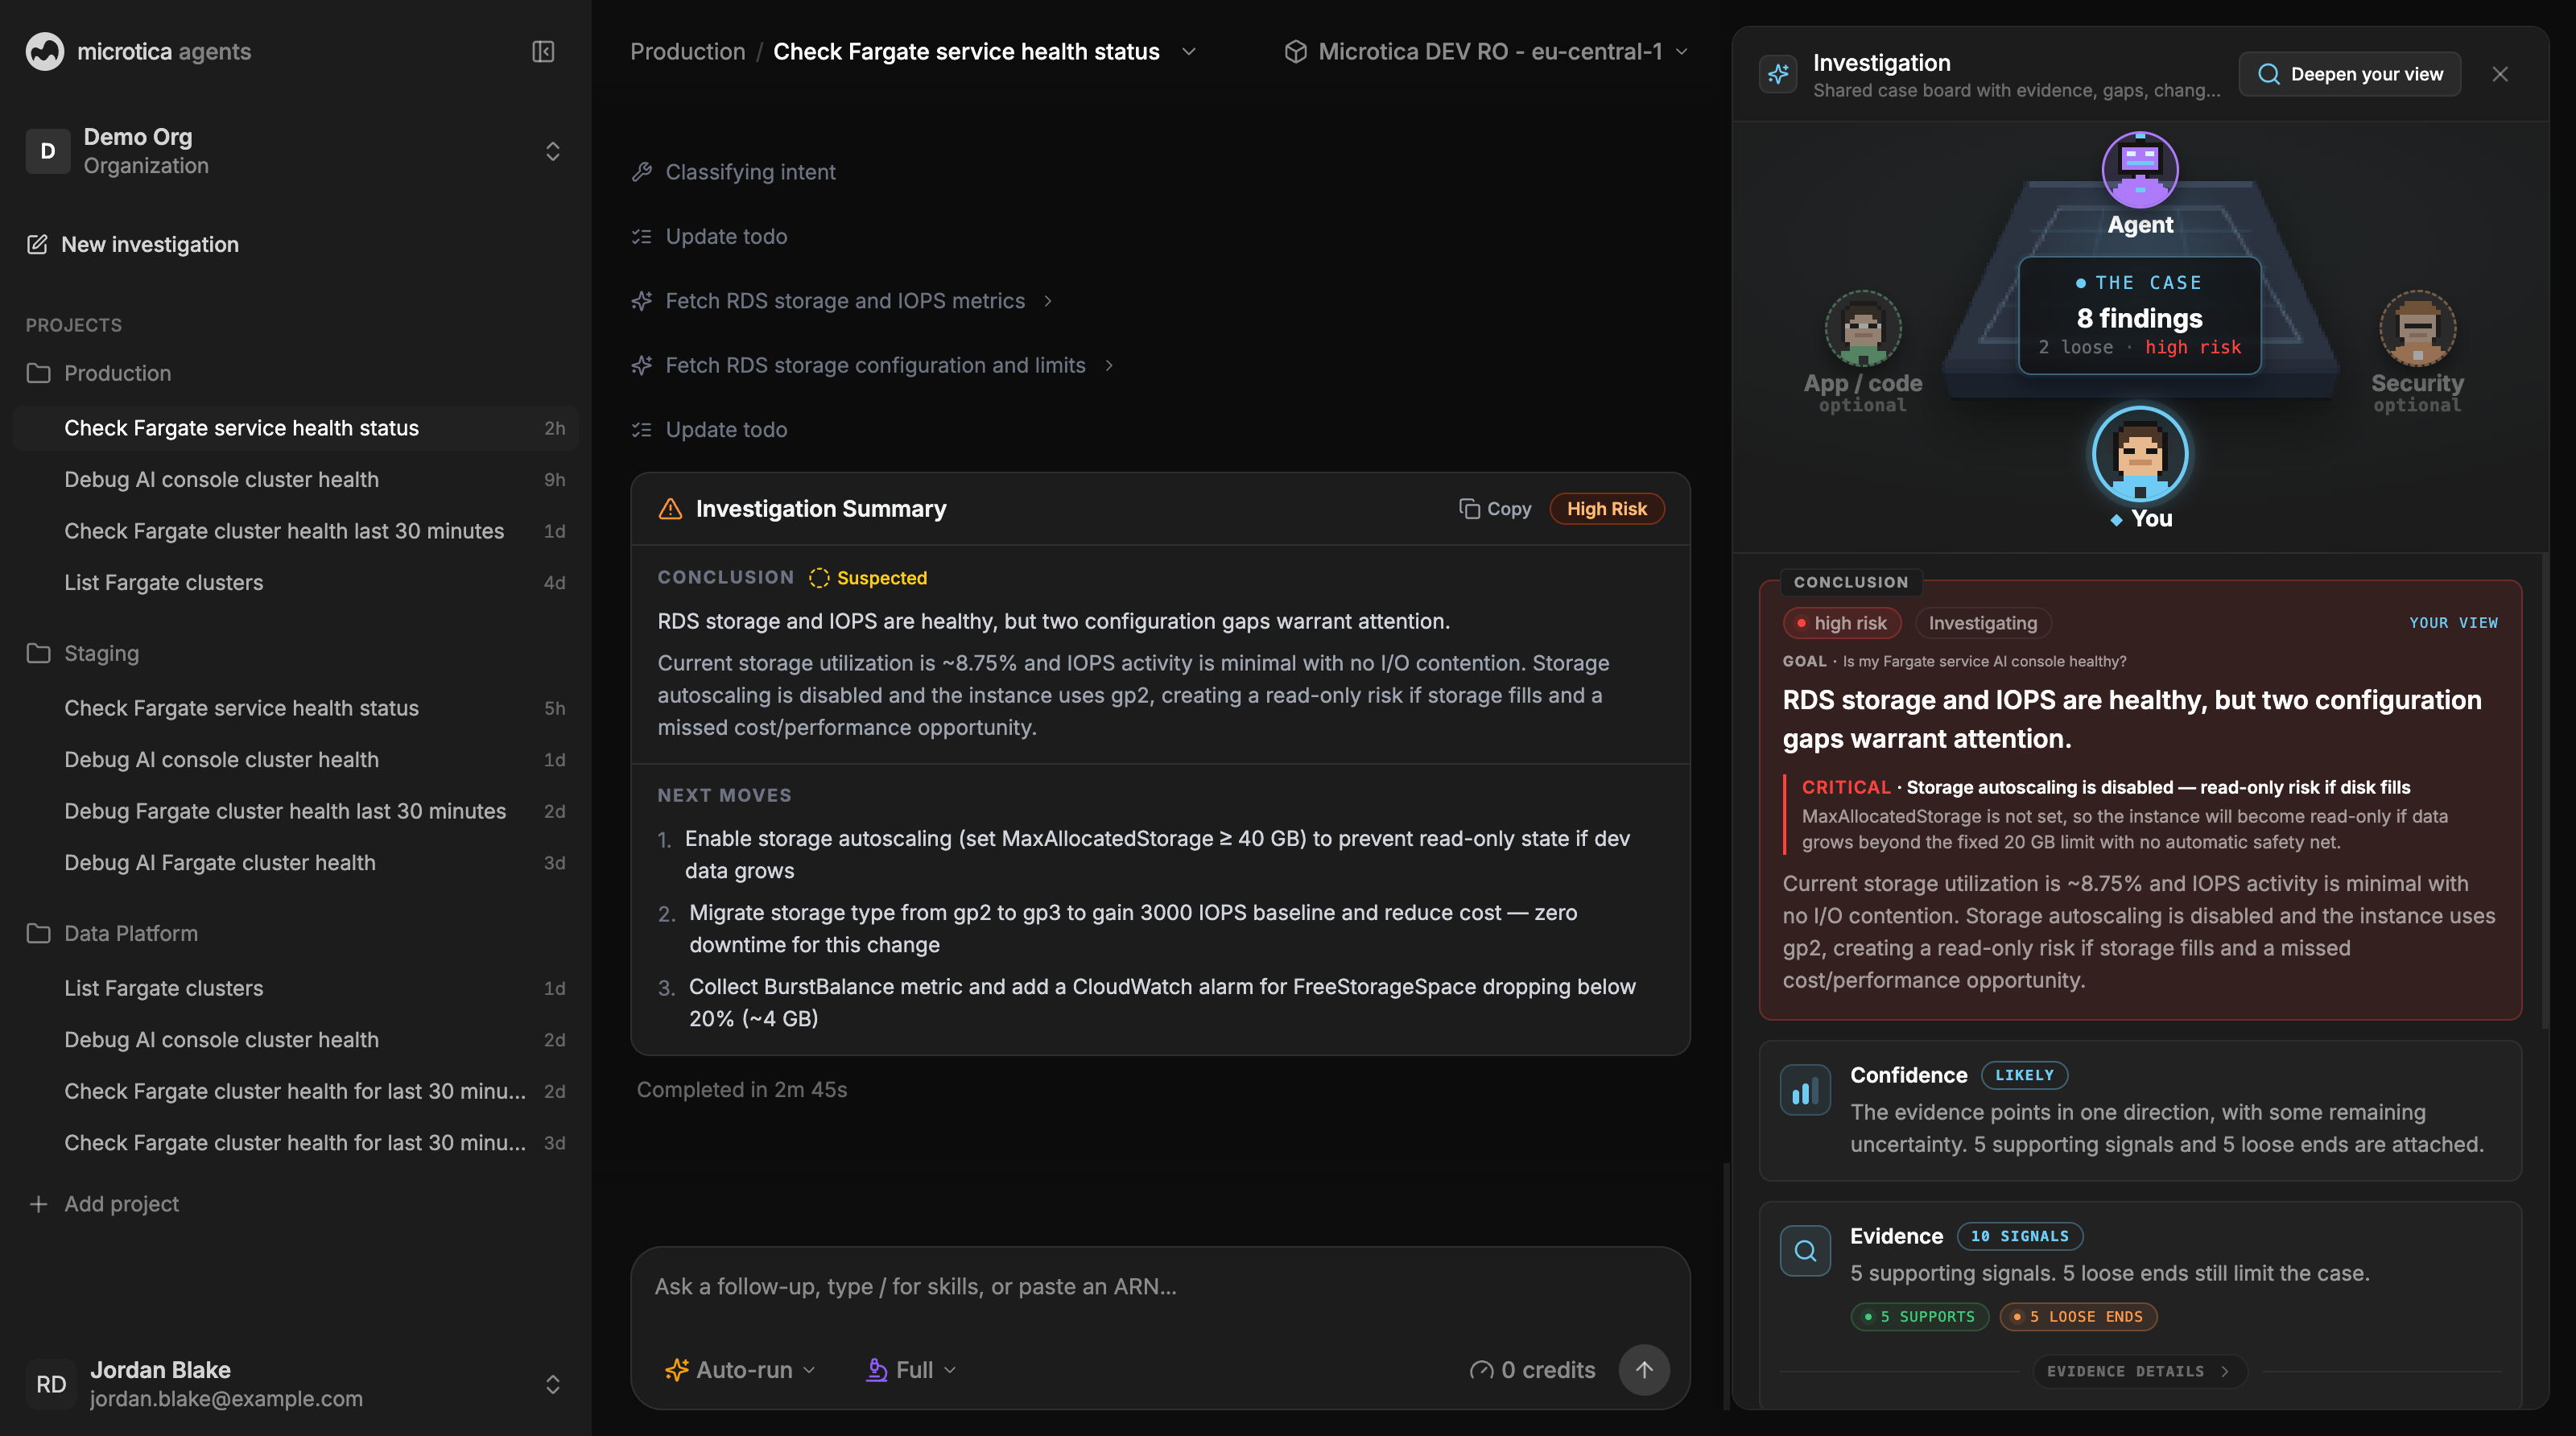
Microtica Agents investigation case board

Trusted by teams shipping on AWS and Kubernetes

SerengetiHeyReachFoundrBoksyVertt+BanzaeDoxmenuThe Local
The intent01 / 05

It starts with a question.

No query syntax, no dashboard tour — you ask the way you'd ask a teammate.

Without the agent 47 min · still guessing
Alert fired five tools open no single source of truth
$ Why is the prod API slow since 2pm? investigating…
Plan the right checks Connect the evidence Hand back the fix
prod incident
p99 latency 180ms → 1.4s
5xx errors +312%
Is it the deploy, DB, ALB, or the cluster?
CloudWatch ECS RDS ALB Logs +7
console.aws.amazon.com/cloudwatch/home#metricsV2
CloudWatch Logs · api-server
14:02:11 WARN db pool wait 4300ms
14:02:16 ERROR upstream timeout /checkout
14:02:19 retrying connection pool...
zsh — kubectl · aws
$kubectl get pods -n prod
api-server-7f9d CrashLoopBackOff 14m
$aws ecs describe-services --cluster prod
… 1,204 lines of JSON, no obvious answer …
$aws rds describe-db-instances | jq .
# incident-prod
dev did the 13:58 deploy touch DB?
sre checking RDS, ALB, ECS...
pm any update?? customers paging
deploy #482? who owns this? metric says ALB logs say DB
1 / Investigate

The agent chooses the checks.

It reads the cloud, logs, deploy history, and config state instead of making you hop between consoles.

Client checkout
ALB p99 latency breach
api-1 healthy
api-2 healthy
api-3 healthy
Database connections pool maxed
Evidence
ALB p99 latency 1.4s breached after 14:01
RDS connections maxed pool wait 4300ms
2 / Connect

Separate signal from noise.

The scattered clues become one causal chain, with loose ends kept visible.

Deploy #482 · 13:58 p99 180ms → 1.4s DB pool out ● root cause
3 / Case

Get the answer and the next move.

Root cause, evidence, confidence, and a fix you approve are packaged into one shared case.

Case · prod API latency root cause found
Root cause DB pool exhausted after deploy #482
Evidence 5 signals · 2 loose ends
Confidence 84%
Fix: raise the DB connection pool, or roll back deploy #482.
Nothing changes until you approve — you're still the lead investigator.
InvestigateConnectCase
scroll to fix this ↓
The plan02 / 05

The agent maps the investigation.

Planning read-only checks full depth
Pull ALB p99 latency
Scan api-server logs
Diff recent deploys
Check RDS connections

It plans the checks a senior engineer would run — before touching a thing.

The legwork03 / 05

Then it does the legwork.

Connecting · AWS eu-west-1 · EKS live
ALB p99 latency 1.4s · breached
api-server logs DB pool errors
recent deploys #482 · 13:58
RDS connections…
12 signals gathered across metrics, logs, events and deploys

Read-only by default — it gathers evidence, it never changes anything on its own.

The insight04 / 05

The evidence points one way.

Deploy #482 shipped at 13:58
Then p99 latency jumped 180ms → 1.4s
Because the DB connection pool ran out
root cause

Deploy #482 raised concurrency without raising the DB pool — connections were exhausted.

It correlates the signals into a cause — not another dashboard for you to read.

The case05 / 05

And the case writes itself.

Case · prod API latency root cause found
Findings 5 · 2 loose
Confidence 84%
Fix: raise the DB connection pool, or roll back deploy #482.

Nothing changes until you approve — you're still the lead investigator.

01The relief

Production doesn't have to mean panic.

Whether you're the one asking or the one being asked, the bottleneck is the same: the answer lives in the cloud, and someone has to go dig. Now the agent digs.

Stop waiting in the queue.

Your app, your question. Ask directly and get a senior-level investigation back — no ticket, no waiting for whoever knows the infrastructure.

Stop being the queue.

It does the root-cause legwork a senior SRE would, so every “is prod ok?” doesn't have to land on you.

It can't make things worse.

Read-only by default. It gathers evidence and proposes a fix; nothing changes until you approve it.

Close the ten tabs. The case has what you need.

02Your role

You're still the lead investigator.

The agent does the legwork and assembles the case. You read it, question it, and approve the fix — the call is always yours.


01
Agent does the legwork
It gathers evidence and assembles the findings — you skip the tab-hopping, not the thinking.
02
You decide & approve
Nothing changes until you say so. The diagnosis is a starting point, not an order.
03
Pull in a specialist
Bring an app-code or security agent into the same case when the problem crosses a line.
THE CASE
5 findings
2 loose · moderate risk
Agent
does the legwork
App / code
joins if needed
Security
joins if needed
You
decide & approve
03Capabilities

Built to investigate, not to chat.

Autonomous investigation, a transparent case board, and read-only access to your real cloud — the parts that make it work like a senior engineer, not a chatbot.

3.1

Autonomous investigation

Ask once; the agent plans the checks, runs them, and adapts as evidence comes in.

3.2

The Case Board

A transparent case: evidence timeline, coverage, confidence balance, recommended fix.

3.3

Reads your real cloud

Given read access, it investigates any AWS service in your account — plus your Kubernetes clusters.

3.4

Triage or full depth

Pick a quick triage or a full investigation per run — you control how deep it digs, and what it costs.

3.5

Memory & skills

Persistent memory and custom skills, so it gets sharper about your infra over time.

3.6

Safe & collaborative

Read-only by default, approve-before-act, and shareable with the whole rotation.

04Use cases

Whatever paged you, start by asking.

Cost spikes, crash-looping pods, latency regressions, broken deploys — whatever the page, it's the same plain-language ask, and a case back every time.

4.1

Cost spikes

$ Our AWS spend is up 30% this week — why?
The resource or deploy that changed, with the cost trail.
4.2

Crash-looping pods

$ The api-server pod in prod is crash-looping.
OOMKilled vs. exit code, the offending deploy, and the fix.
4.3

Fargate task failures

$ My ECS service won't stay healthy.
Task metrics, health-check config, IAM, and the cause.
4.4

Latency regressions

$ The API got slow around 2pm — what changed?
The metric/log/event correlation pinned to a time range.
4.5

Deploy-induced incidents

$ Did the last deploy break checkout?
The change correlated to the error spike.
4.6

Permission & connectivity

$ The service can't pull from ECR.
The exact IAM policy or security-group rule to fix.
The difference

Ten tabs become one case. Forty-seven minutes of guessing become two minutes to the root cause.

Find the root cause before the next page.