
What is Microtica Agents
Microtica Agents gives your team an AI investigator for infrastructure incidents. You ask what’s wrong — or mention it under an alert — and the Investigator digs through your connected accounts and comes back with a case: a working hypothesis, the evidence behind it, and the next moves. It’s built for small dev teams who run real infrastructure but don’t have a dedicated SRE.
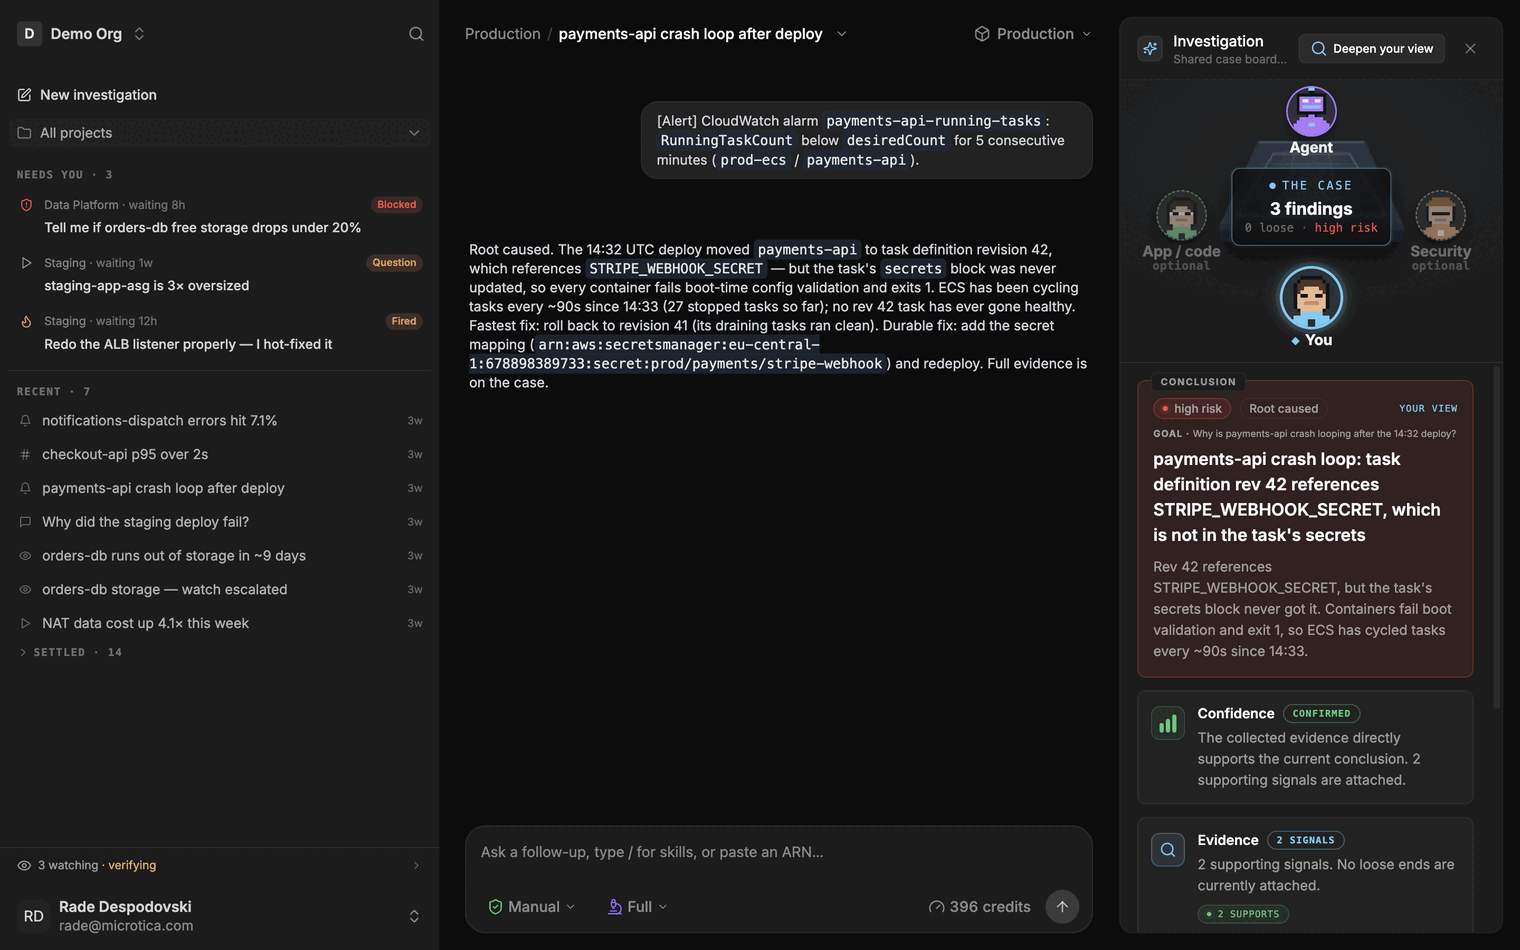 A session in the console — what it found, and the case board beside it.
The three surfaces
Slack. The Investigator works in your Slack the way a teammate would. Mention @Microtica under an alert, and it reads the thread, digs through the connected accounts, and reports back in the same thread with what it found. Reply in the thread to push further, or press Deepen to have it re-examine the case at full depth. When it needs something from you, it asks — in the thread, not in a dashboard you forgot to open.
The inbox. Every case also lives in the console, in one list ordered by whether it needs a human. What’s waiting on you sits on top and reads larger — a question, a failed run, a watch that tripped. Everything quiet sits below it in one dim line each. Watches the Investigator is holding for you collapse into a single heartbeat at the foot of the list. You never hunt through chat history to find out what’s still open.
Cases. An investigation is a case, not a chat log. Each case shows a Working hypothesis with a plain-language confidence, Findings individually marked Confirmed, Likely, or Low, and concrete Next moves. Follow-ups don’t start over — they add a chapter to the same case’s journal, so the history of an incident reads front-to-back in one place.
What the Investigator can reach
Once you connect an environment, the Investigator gathers evidence across it:
- AWS — ECS, EC2, RDS, Lambda, CloudWatch and more, through a read-only role that lives in your own account.
- Kubernetes — pods, deployments, events, and logs, through read-only access you apply yourself.
- Git providers — your repositories: code, commits, diffs, branches, and pull requests, to connect a symptom to the change that caused it.
- Cloudflare — DNS, Workers, and edge configuration, through an API token you scope and paste.
- MCP servers — any remote MCP server you connect, adding its tools to the Investigator’s built-ins.
You decide what it can see, and every grant is inspectable before you make it — the AWS template and the Kubernetes manifest are both open for review, and access can be revoked at any time. The details are on Security & access.
Connecting your first environment takes about two minutes, and your first case usually lands a few minutes after that.
Next: Quickstart